BIODIVERSE.UNSW.EDU.AU

Welcome to the Biodiverse web site. 

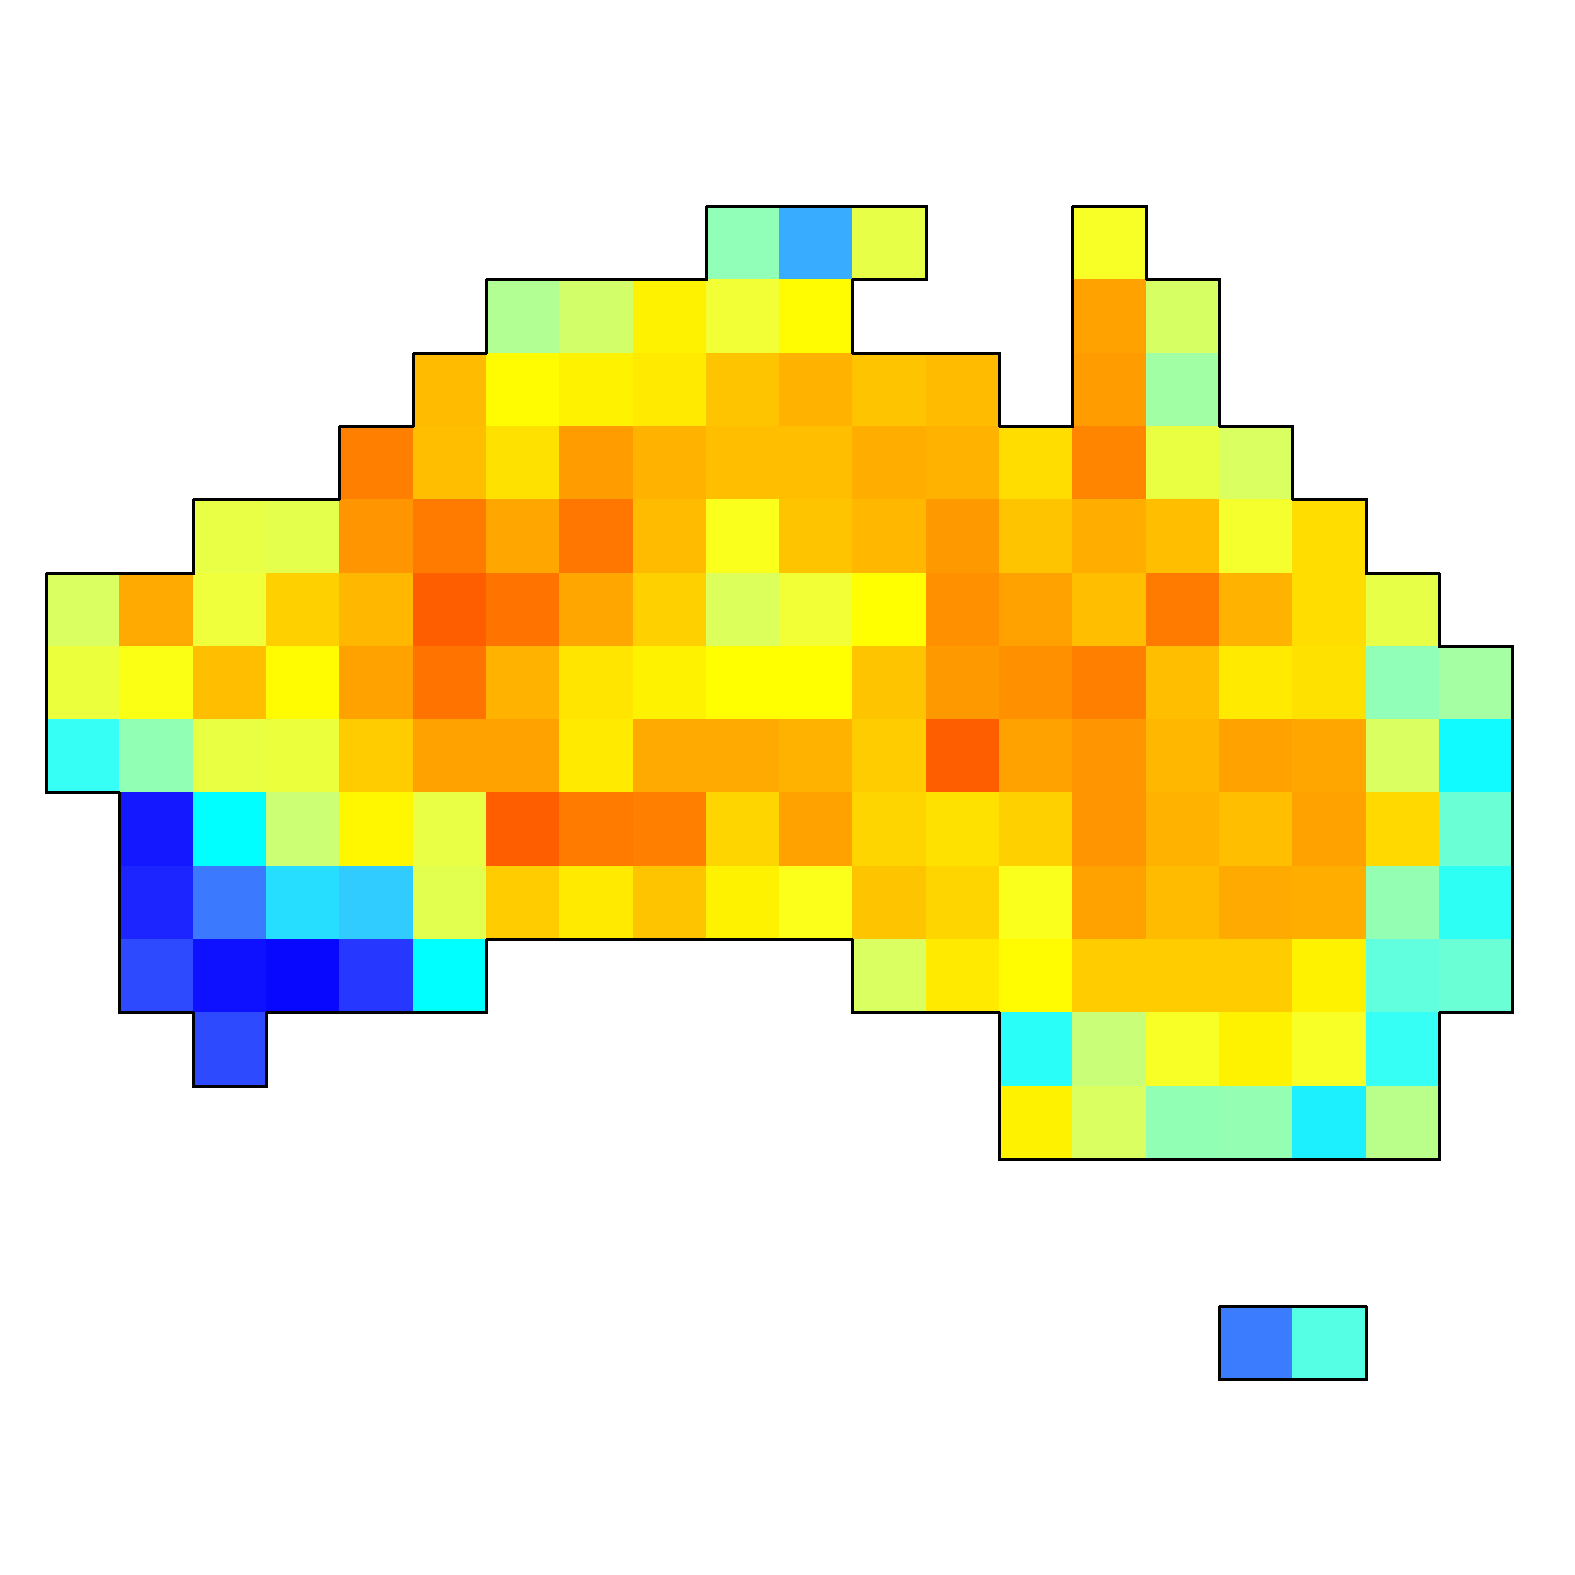
Biodiverse is a tool for the spatial analysis of diversity using indices based on taxonomic, phylogenetic and matrix-based (e.g. genetic distance) relationships, as well as related environmental and temporal variations. Biodiverse supports four processes: (1) linked visualisation of data distributions in geographic, taxonomic, phylogenetic and matrix spaces; (2) spatial moving window analyses including richness, endemism, phylogenetic diversity and beta diversity; (3) spatially constrained agglomerative cluster analyses; and (4) randomisations for hypothesis testing. Biodiverse is open-source and supports user developed extensions. It can be used both through a graphical user interface (GUI) and through user written scripts.

A paper describing the analyses is currently in prep.  An overview is provided in Dan Rosauer's talk at TDWG2008
Rosauer, D.F. & Laffan, S.W. (2008) Linking phylogenetic trees, taxonomy & geography to map phylogeography using Biodiverse. Taxonimic Data Working Group 2008, Perth, Australia. [PPT] [SWF with audio] .

Further information concerning the analyses is available from Crisp et al. (2000), Laffan & Crisp (2003), Bickford et al. (2004), Bickford & Laffan (2006) and Jones & Laffan (in press).

NOTE: The previous online service has been removed. We have completely rebuilt the interface using a stand-alone GUI. The new system includes analyses for taxonomic, matrix and phylogenetic indices. Contact Shawn.Laffan@unsw.edu.au if you wish to be advised when the system is released. Some sample screen shots are given below.


Screen shots

Outputs tab listing available data sets. Several data sets can be stored in a project.
View labels tab with matrix and taxonomic tree. Selecting a set of labels (species) highlights them on the map, the tree and the matrix.
Spatial analysis tab with subset visible. A large number of spatial analyses can be selected and the neighbourhoods can be arbitrarily complex. Users can incorporate their own analyses using additional libraries.
Spatial analysis coloured by CWE. Results can be plotted with overlain shapefiles.
Cluster analyses can be conducted to aggregate groups (normally cells) using a user extendable set of functions, optionally with a set of spatial constraints. The groups under each resulting cluster node can then also be analysed spatially.
Cluster analysis with thirteen clusters coloured.
Cluster analysis with clusters coloured by Corrected Weighted Endemism calculated for each of the thirteen selected cluster nodes.

Reference list

Bickford, S.A., Laffan, S.W., de Kok, R. & Orthia, L. (2004) Spatial analysis of taxonomic and genetic patterns and their potential for understanding evolutionary histories.  Journal of Biogeography , 31, 1715-1733.
Bickford, S.A. & Laffan, S.W. (2006) Multi-extent analysis of the relationship between pteridophyte species richness and climate.   Global Ecology and Biogeography , 15, 588-601.
Crisp, M., Laffan, S., Linder, H., & Munro, A. (2001) Endemism in the Australian Flora.  Journal of Biogeography , 28, 183-198.
Jones C. &  Laffan S.W. (2008) Lexical similarity and endemism in historical wordlists of Australian Aboriginal languages of the greater Sydney region. Transactions of the Philological Society , 106, 456-486.
Laffan, S.W. & Crisp, M.D. (2003) Assessing endemism at multiple spatial scales, with an example from the Australian vascular flora. Journal of Biogeography , 30, 511-520.

Credits

The code and algorithms were developed by Shawn Laffan. The GUI was developed by Eugene Lubarsky. Dan Rosauer implemented the phylogenetic analyses. Manoj Chandra ported the original version to a PERL module system and developed the web interface.

This research has been supported by ARC linkage grant LP0562070 (Laffan and West) and UNSW FRGP funding to Laffan.